
1 min read
Work In Process (WIP) Inventory Control Dashboard
A Streamlit web app for real-time WIP data tracking and automated summary reporting
WIPData AnalyticsAutomationStreamlit
Features
Tech Stack
PythonStreamlitPandasPlotlyExcel
A Streamlit web app for real-time WIP data tracking and automated summary reporting
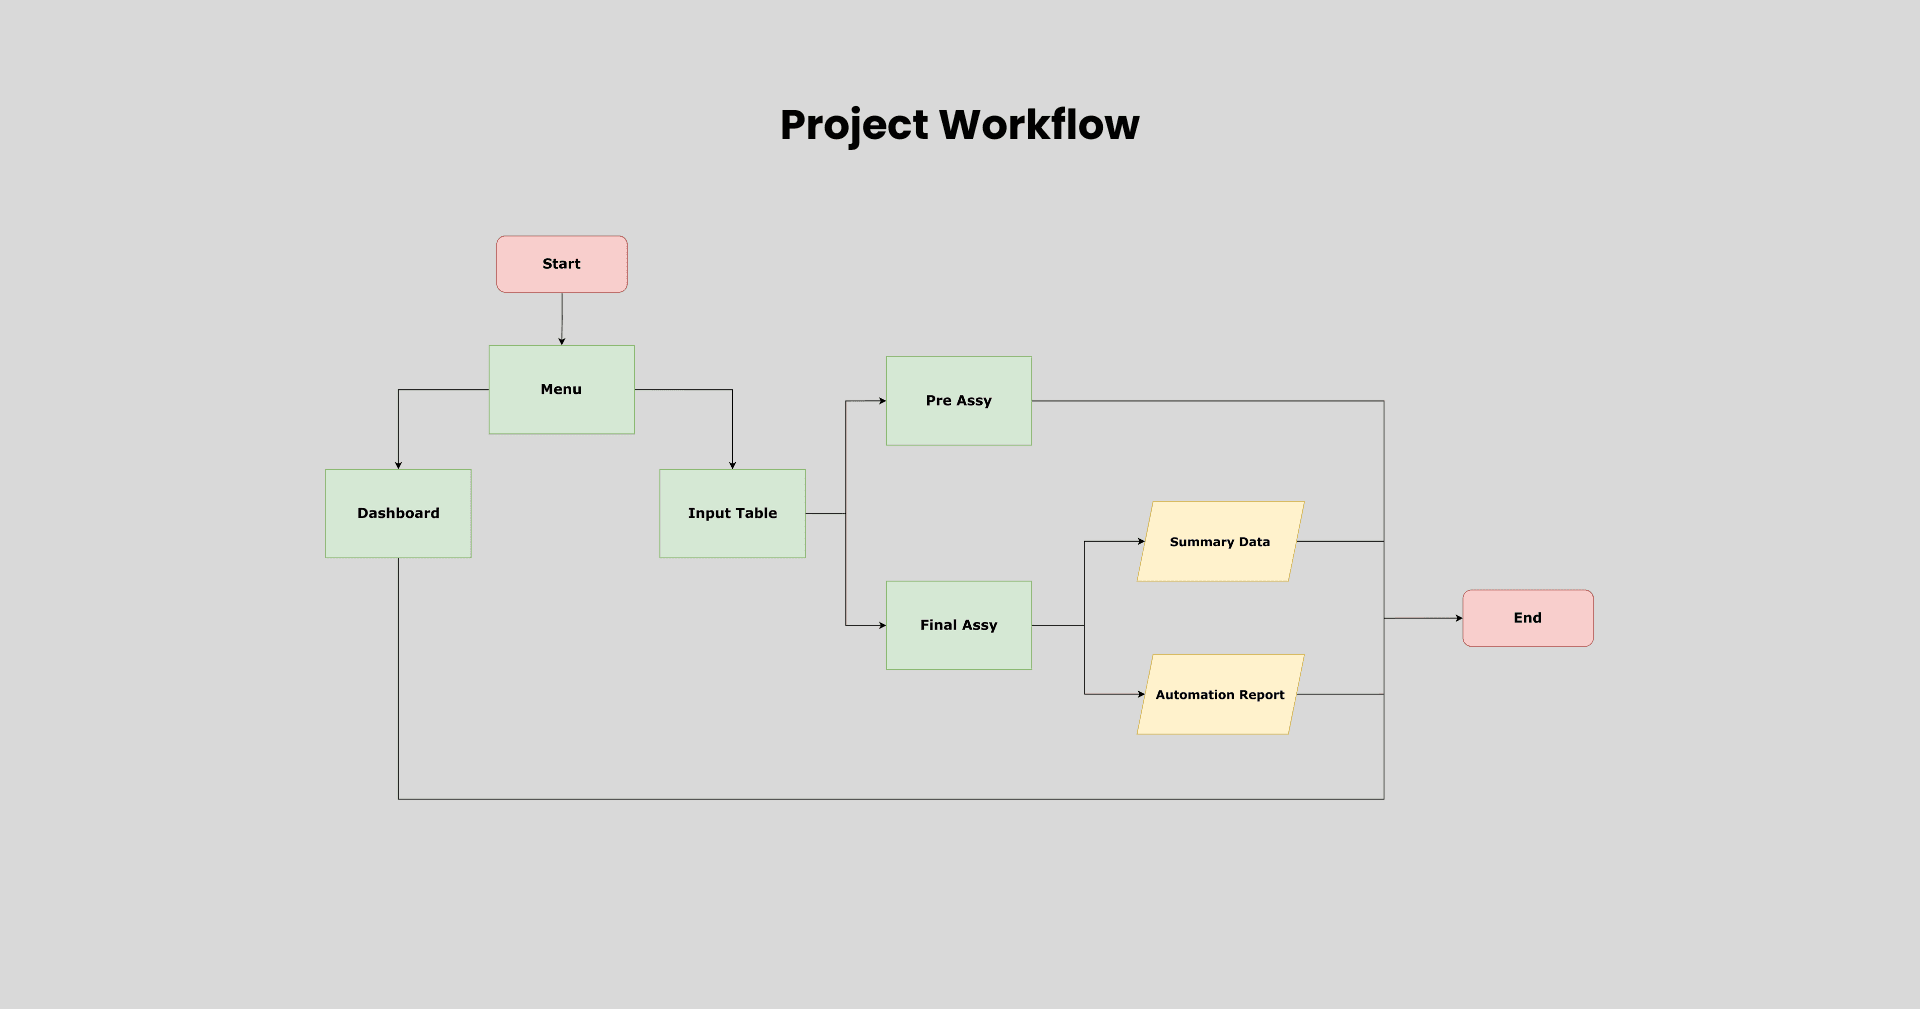
This project introduces a Streamlit-based web application designed to streamline and enhance the management of Work In Process (WIP) data within a cable assembly manufacturing environment. The traditional manual process for inputting and tracking WIP data was inefficient, time-consuming, and prone to human error. To address these challenges, the project delivers a digital solution that enables users to perform real-time data entry, automatic summary generation, and insightful analytics through an interactive dashboard.
The application consists of two primary modules:
Input Table: Allows categorized data input for two key production stages: Pre-Assembly and Final Assembly. Users can sort, edit, and add new data directly via the interface. It also features an automatic summary generator that pivots and aggregates component data (e.g., terminals, wires, materials) for reporting.
Analytics Dashboard: Provides interactive data visualizations using Plotly, including bar charts, pie charts, and line graphs. These visualizations offer insights into monthly component usage, cost trends, and distribution across various product categories. Users can filter data per month and compare usage across different car brands or component types.
This solution significantly improves operational visibility and efficiency by:
While still in its initial phase, the web app lays a solid foundation for scalable manufacturing analytics and future enhancements, such as file uploads, automated report exports, and deeper business logic integration.