
1 min read
Dashboard for Grouping and Analyzing Donation Program Performance
Interactive Power BI dashboards for visualizing donation and distribution data
Power BIData VisualizationCommunity Service
Features
Tech Stack
Microsoft Power BIExcel
Interactive Power BI dashboards for visualizing donation and distribution data
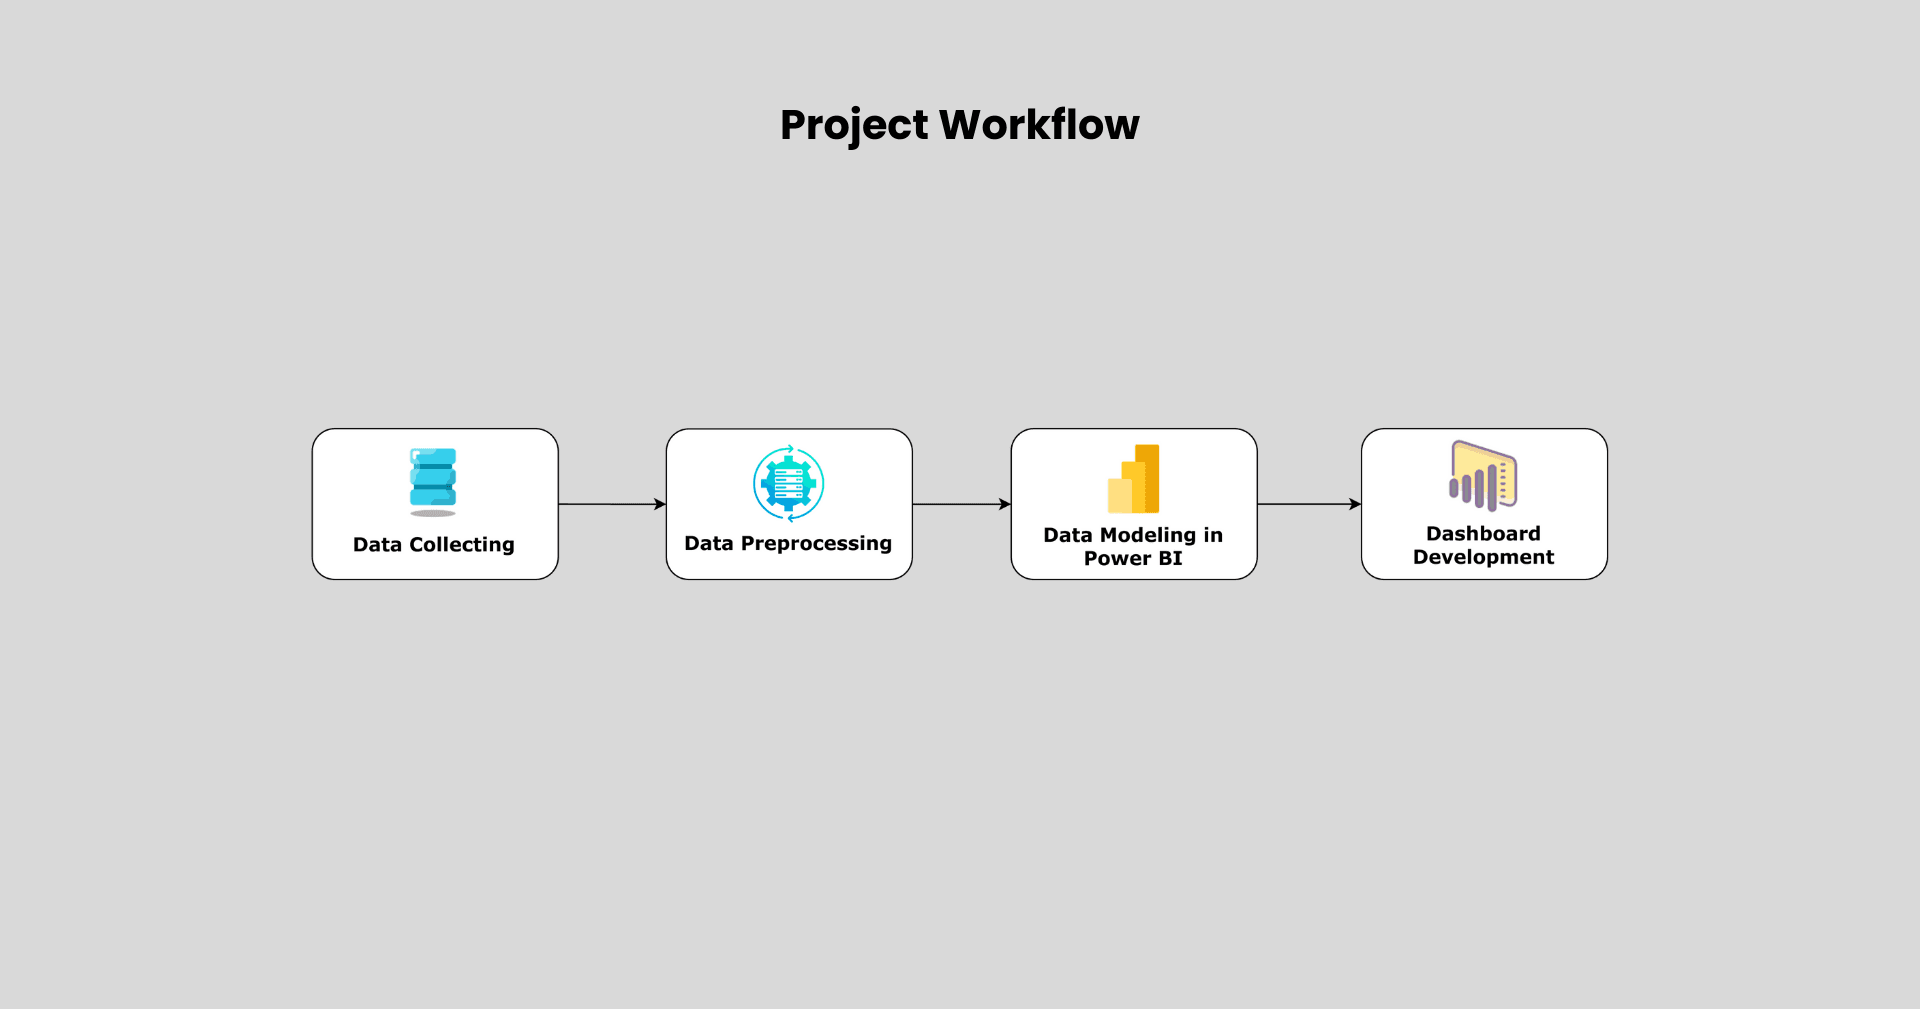
This project presents the development of interactive dashboards using Microsoft Power BI to support data transparency and impact measurement for a non-profit organization. Conducted as part of a community service program at Yayasan Dana Sosial Al-Falah (YDSF), the initiative focused on visualizing key data related to fund collection and distribution activities across multiple branches and cities in Indonesia.
Over 49,000 donation records from 13 branches and 28,000 distribution records across 61 cities were cleaned and integrated into unified reports. These dashboards enabled stakeholders to gain insights into donor behavior, program performance, and regional impact using interactive visuals such as bar charts, line graphs, and slicers.
To enhance usability, more than five interactive components were implemented, including menu buttons and dynamic filters for effortless navigation and personalized data exploration. In addition to dashboard creation, a step-by-step guidebook was authored, and training sessions were conducted to equip internal teams with dashboard-building capabilities.
The solution brought tangible benefits:
This project demonstrates how Power BI can transform static data into actionable intelligence, making a direct impact in the non-profit sector through better reporting, accountability, and collaboration.