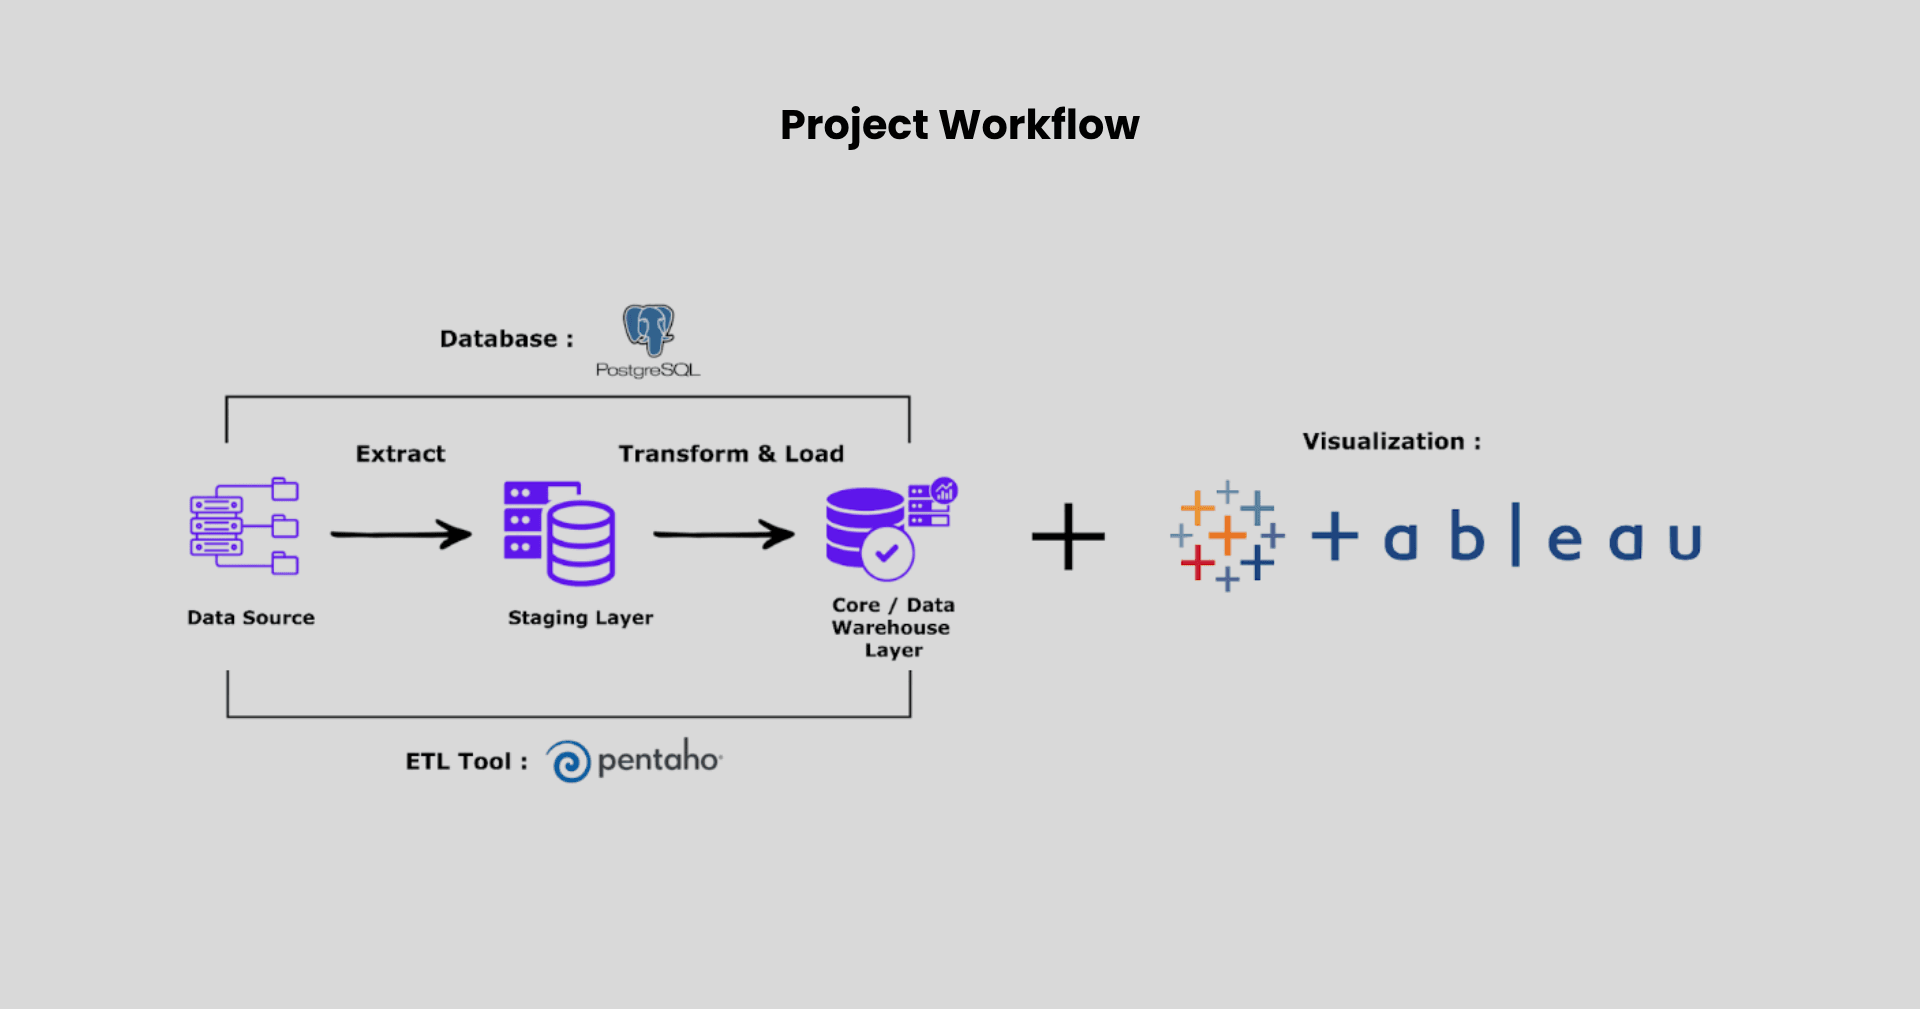
Project Overview
This project is adapted and developed from the Udemy course
Data Warehousing – The Ultimate Guide.
It comprises a practical demonstration and case study aimed at architecting and
implementing a professional data warehouse end-to-end.
Additionally, I am enhancing it by restructuring the data into yearly segments
for designing and creating analytical visualizations for sales profitability
using Tableau Desktop. This practical demonstration provides a comprehensive
understanding of establishing a complete end-to-end ETL (Extract, Transform,
Load) workflow. It applies theoretical ETL concepts in a practical scenario,
showcasing the entire workflow from extracting source data to loading it into
the target schema.
This case study helps visualize and understand the practical steps and
considerations involved in building an ETL process. The project also involves
creating a dynamic sales profit dashboard to analyze year-over-year profit
performance.
The dashboard presents summaries of total profit, total price, and total cost
for the current and previous year, monthly KPI data, and comparisons of profit
by product categories. It also showcases weekly profit trends, highlighting
weeks above and below average, and displays top profits by product name and
brand. The interactive dashboard allows users to filter data by selecting any
desired year, featuring dynamic charts and graphs for enhanced data analysis.